Blueshift Recommendations Studio: How to Rank Inside Recipes

Blueshift Recommendations Studio

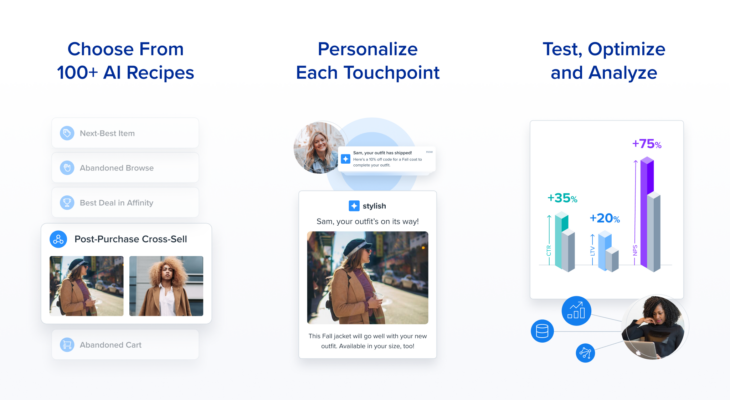
Last month, we announced the expansion of the Blueshift Recommendations Studio that gives every marketer the power of AI to drive intelligent and highly personalized recommendations. This expansion includes the launch of 100+ pre-built AI marketing recipes, preloaded with configurations for common campaigns, like abandoned carts, price drops, newsletter feeds based on affinities, and cross-merchandising based on the wisdom of the crowds. 

Today’s blog post is the first of many that will provide an under-the-hood view of how the expanded Recommendations Studio works. Today’s post is written by Anmol Suag, senior data scientist at Blueshift. You can also read a follow-up post about using Auto-encoders to find similar items to recommend.  
INTRODUCTION

Ranking Items In Recommendations

Given a user catalog, item catalog, and a history of interactions between the users and items, we could create various types of recommendations for a given user. Some of these could be:

  • Items with similar attributes to to user’s previously interacted items
  • Items that other users like them have interacted with
  • Next best items to user’s previously interacted items based on all user interactions
  • Popular items in user’s location or stated preferences
  • Items from other catalog attributes that are commonly browsed

The list of items coming out of each of the aforementioned recommendation types could be different and would vary from user to user based upon their activity, location, implicit and explicit interests etc. We call the underlying algorithms as Candidate Generation Algorithms and the list of items generated by them as Candidates

This candidate set would be a lot smaller as compared to the size of the entire item catalog. The central challenge of ranking is once we are down to a small candidate set, how do you order these candidates for a given user from the most relevant to the least. This problem is called Learning to Rank and we would be talking about how we do it in this blog.

Learning to Rank is a continuous process that consists of 4 phases and we discuss each of them below in depth

Blueshift Recommendations Studio 1

Data Collection

First phase of Learning to Rank consists of collecting user engagement data from items shown to users via website, mobile app or email or any other customer experience channel. In the exploration phase candidate items are randomly shown and logged. A subsequent positive interaction with the shown items is considered positive interaction and lack of it a potential negative interaction.

Blueshift Recommendations Studio Data Collection

Feature Engineering

The second phase of Learning to Rank is generating rich features from the collected data. The user-item interaction dataset collected during the exploration phase is now enriched with user features, item features, and user-item features. Broadly these features can be divided into following categories:

  • User Catalog Features: User’s country, region, tags followed, brands followed, site-age, gender, etc.
  • User Activity Features: User’s historical activity RFM, category affinity, brand affinity, etc.
  • User Campaign Features: User’s historic click rate, open count, last click time-diff, etc.
  • Item Catalog Features: Item’s category, site-age, tags, title, brand, audio-visual features, etc.
  • Item Activity Features: Item popularity, trend, category’s popularity, brand’s popularity, etc.
  • Item Campaign Features: Item’s historic click rate, sent count, etc.
  • User-Item Features: RFM of user’s interactions with the recommended item, category, etc.
  • Computed Features: Relevance of recommended item to user, computed through context embeddings

More than 500 features are used to essentially capture:

  • Quality of item
  • Relevance of item to the user
  • Propensity of user to interact
  • Affinity of user to item’s attributes
  • Fatigue of user to item’s attributes

ML MODELING

Selecting The Type of Model to Implement

Now that we have clarity on our goal, which is to come up with a model that is capable of re-ranking a set of candidates given a user and features, we would want to choose the type of model we would like to implement. We could go with XGBoost or Neural Networks or even a simple Logistic Regression. 

The problem with Logistic Regression and Neural Networks is that they can not work with empty values in a data set. Although XGBoost and Neural Networks are the closest we have to Universal Approximators, Neural Networks are more suited for tasks where there’s some hierarchical structure in data (like vision, text and speech processing tasks). 

Hence, we would use XGBoost to train a model for learning to rank. With an XGBoost model, we can either use a point-wise approach (classification) or a pair-wise (LambdaMart) approach just by switching the loss function from binary:logistic to rank:pairwise. A pair-wise approach is more suited for this task.

Blueshift Recommendations Studio ML modeling

INFERENCE

Learning to Rank

Once a model has been trained, it can be used to reorder a candidate-set to rank those items higher that have a higher likelihood of getting clicked! This phase is called the exploit phase where the trained model is used to reorder the items.

Blueshift Recommendations Studio Inference

We have now learned to rank!

PERFORMANCE

Finding The Best MAP Values

In absence of a trained model to re-order candidates, usually the items are ordered by popularity, freshness, or some form of relevance. Note that all these features are inputs for LambdaMart model training. On historical campaign data for a client, a test was performed to calculate the Mean Average Precision (MAP) of these hard ordering techniques versus a trained LambdaMart model.  

Blueshift Recommendations Studio MAP Values

It was found that the trained LambdaMart model has the best MAP values and is able to figure out a combination of individual features that provides better re-ordering than any single feature alone.

REFRESHING WITH DATA

The Continuous Feedback Loop

Once a model has been trained, it needs to be refreshed frequently with new data to keep itself adapting to changing user and item behaviors. This is achieved through a continuous feedback loop where a sample of users during each campaign is set aside for exploration while others are served reranked recommendation. The exploration percentage is a function of the previous model’s performance. A good model would need less exploration in subsequent campaigns and vice-versa.

Recommendations Studio Feedback Loop

CONCLUSION

Feedback Loop Helps The Model Retrain Frequently

The Learning to Rank algorithm of the Blueshift platform continuously learns to rank items for a user by leveraging a rich feature set derived from catalog and history. The features include textual, multimedia, and RFM of historical activity, as well as embeddings to represent user context. A healthy explore/exploit feedback loop helps the model retrain frequently to adapt to changing user and item preferences. The initial tests have proved that a LTR model can fetch higher click rates as opposed to reordering candidates by any individual feature or random.

Anmol Suag is senior data scientist at Blueshift. 


We announced the expanded Recommendations Studio and the AI recipes at Engage 2022 San Francisco. Go to our Engage 2022 on-demand page to watch the session hosted by Manyam Mallela, Blueshift co-founder and head of AI.