01.18.24
January Updates
Audience Insights
This new report will offer insights into your customers based on your customer and event data. It will allow you to understand how different customer cohorts (based on any customer attribute of your choice) are contributing to your top-line and bottom-line metrics such as revenue, orders, visits and other goal metrics. For instance, if you are managing an e-commerce or retail brand, the report will allow you to evaluate order distribution by state or average order value by customer joining month. If you’re managing a media brand, you could analyze the total hours watched by subscription tier or average hours watched by sign-up month. Similarly, if you are managing a consumer finance brand, you could examine the average number of credit card applications by customer age or total revenue by customer type. In a nutshell, these insights will help you understand your audiences better, irrespective of the type of industry or business you are in!
The highlight of this report is that you do not need to run any marketing campaign to get such insights into your customer base. Simply create a new report using the easy and intuitive Insights user interface, choose report type = ‘Audience Insights’ and start getting insights about your customers in the form of easily digestible charts.
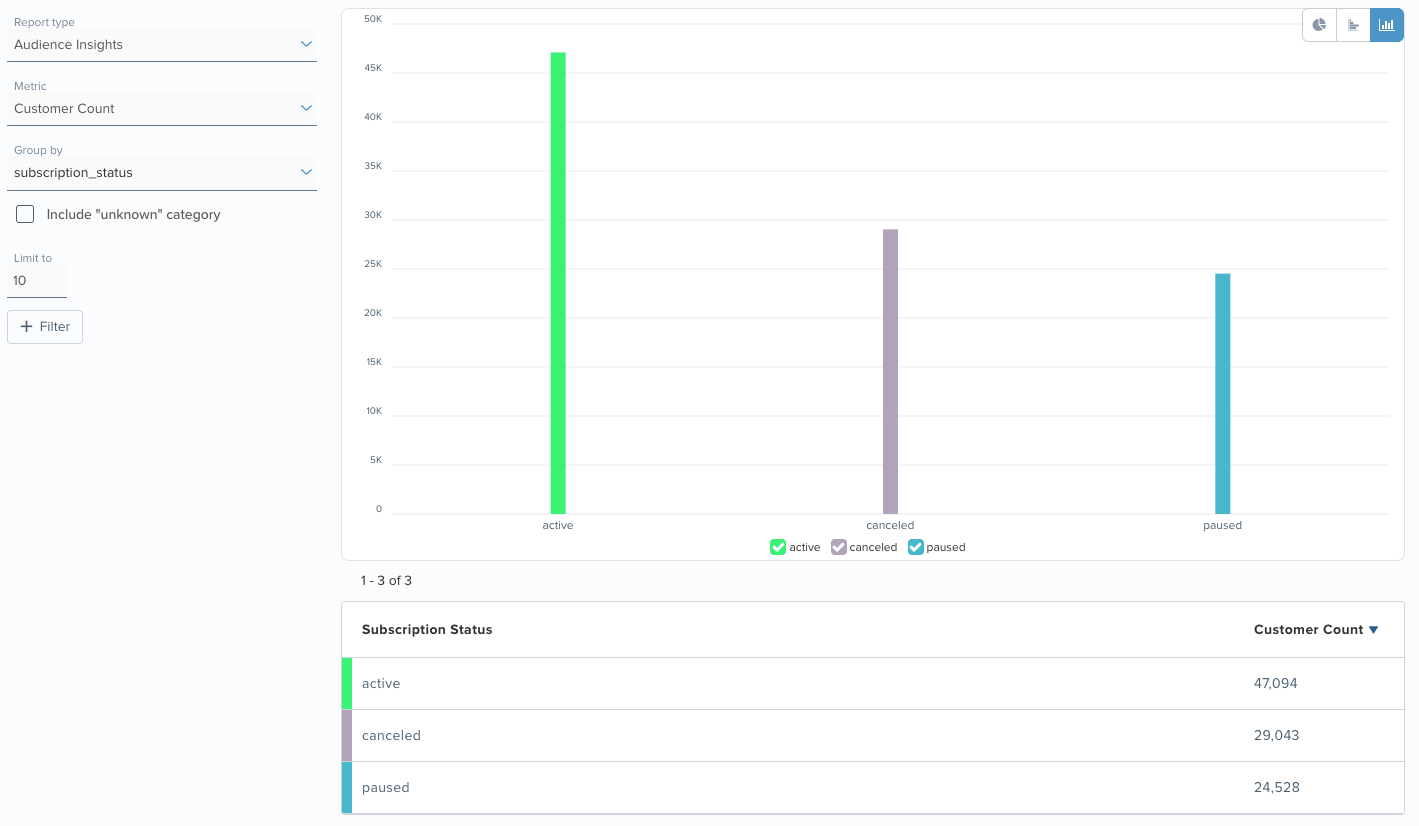
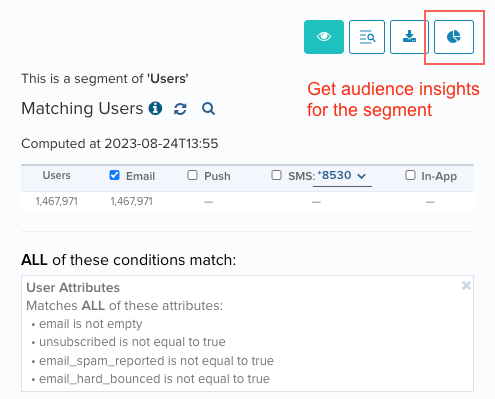
In addition to analyzing your entire customer base, the audience insights reports also allow you to analyze customers in specific segments. All you need to do is select ‘+Filter -> Segment’ and select the segment/(s) of your choice. There is also a shortcut to audience insights from the segment builder. So, you could use audience insights in your segment-building process to identify the right set of customers as well.
Campaign Reporting by Execution Time
For campaigns with longer durations and recurring campaigns, you may want to measure how a particular send performed. For example, you may have a weekly newsletter and you’d like to check how the newsletter that was sent in the first week performed as compared to that sent in the second week.
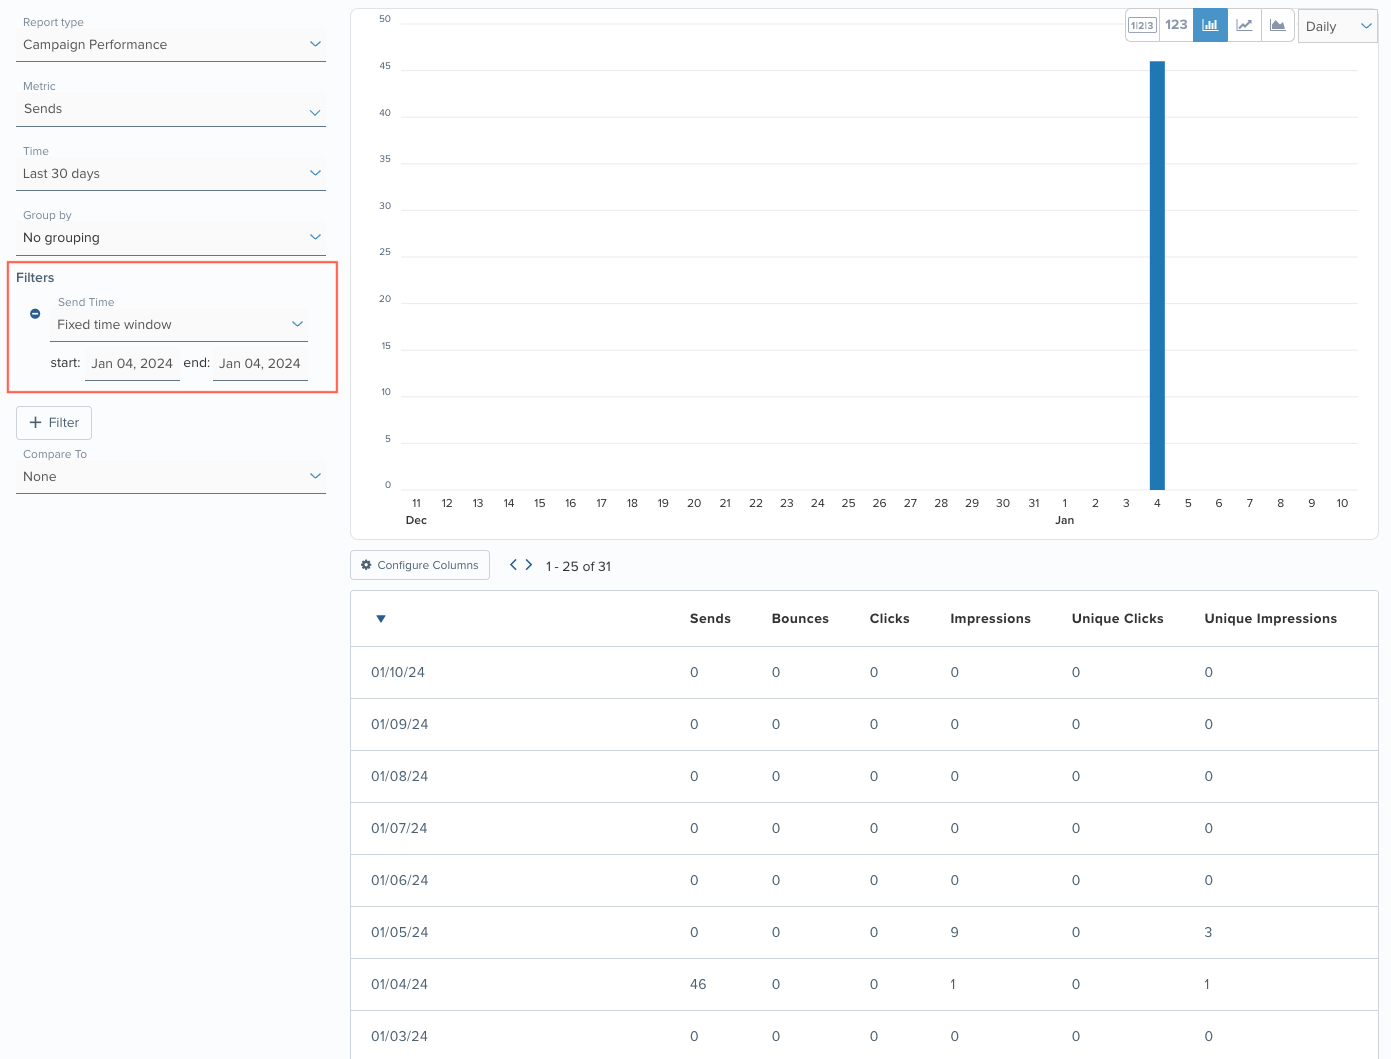
You could now do so using our execution time filtering functionality. On any Insights report, dashboard, campaign index screen or campaign detail screen, simply choose the ‘execution time’ that you want to limit your analysis to. The resulting report will only show downstream metrics (e.g. opens, clicks, bounces) that originated from the campaign sends that occurred in the specified window of time and will exclude metrics from campaign sends outside the selected time window, even if those metrics were from the same period.
For instance, in the screenshot below, the reporting time window of the Insights report is set to last 30 days but the campaign send time window is set to January 4, 2024. Hence, only the campaign activities (e.g. bounces, impressions, clicks, etc.) that occurred from the campaign sent on January 4th will be shown in the report. Even if there are opens and click events in the 30-day period that originated from sends before or after January 4th, they will not be included in the analysis.
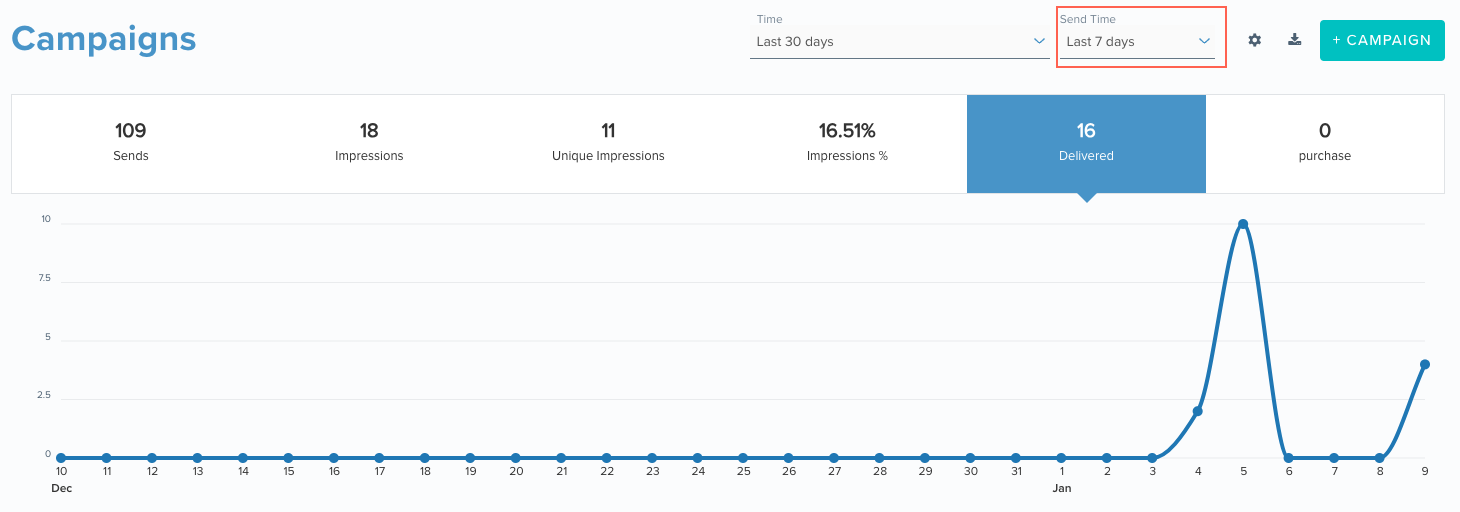
Similarly, in the screenshot of the campaign dashboard below, the reporting time window is set to the last 30 days but the campaign execution time window is set to the last 7 days. Hence, only the campaign activity that occurred from the messages sent over the last 7 days will be shown in the report.
Left Navigation Refresh
As part of this update, we will revamp the left navigation panel to better align with the specific functions of Blueshift’s features. You’ll notice that features will be organized into sections: Orchestration, Customer AI, Insights, Apps, and Data. Additionally, items under the Setup (gear) menu in the top navigation panel will move to the left navigation panel.
You can find the full details of the changes here.
Sign In With Google
We have made our sign-in process simpler. If you have a Google workplace account, you can now sign into the Blueshift platform using your Google credentials. This will streamline your login flow as you will no longer need to remember and enter your password. Once you authenticate using Google, you will be able to access Blueshift with a single click.
With less time spent in security workflows like logging in, and resetting passwords, we hope that you will be able to spend more time on activities that drive ROI for your business.
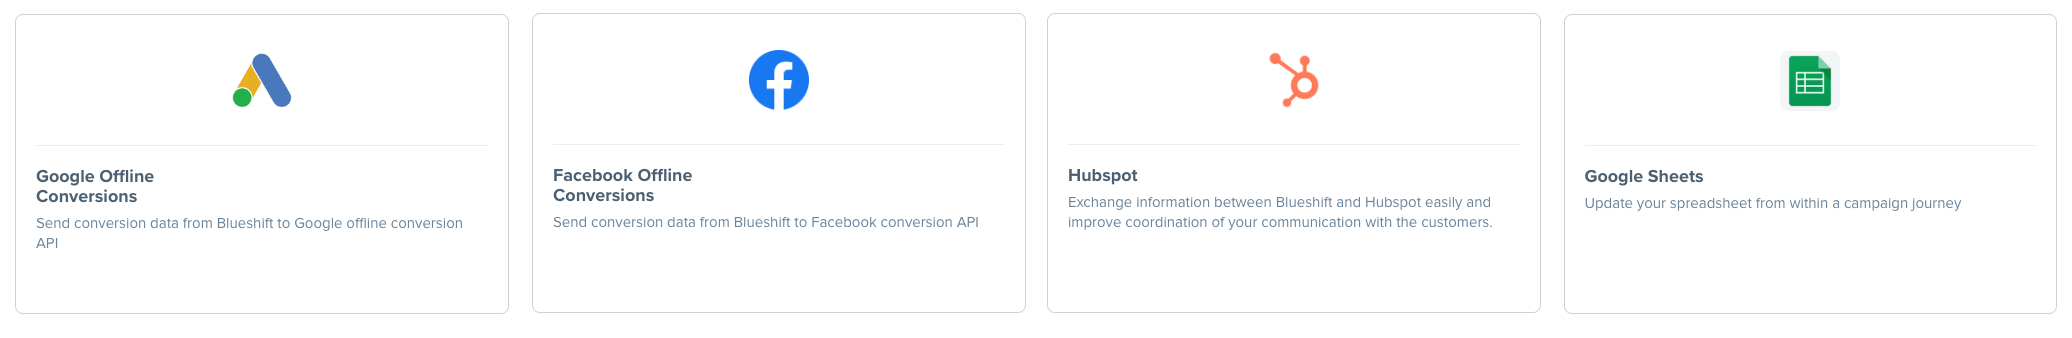
New Cloud Apps
We have added the following native cloud apps to our App Hub to offer you more ways to connect with other business and productivity tools:
- Google Offline Conversion: If you are already sending your conversion data to Blueshift, you can relay that data to Google Conversion API to further optimize your Google ad spend
- Facebook Offline Conversions: If you are already sending your conversion data to Blueshift, you can relay that data to Meta Offline Conversions API to further optimize your Facebook ad spend
- Hubspot: With the Hubspot app, you can create and update contacts in Hubspot from a campaign journey
- Google Sheets: With the Google Sheets app, you can update any Google spreadsheet from a campaign journey. For example, you can add or update records in a spreadsheet containing a list of new subscribers
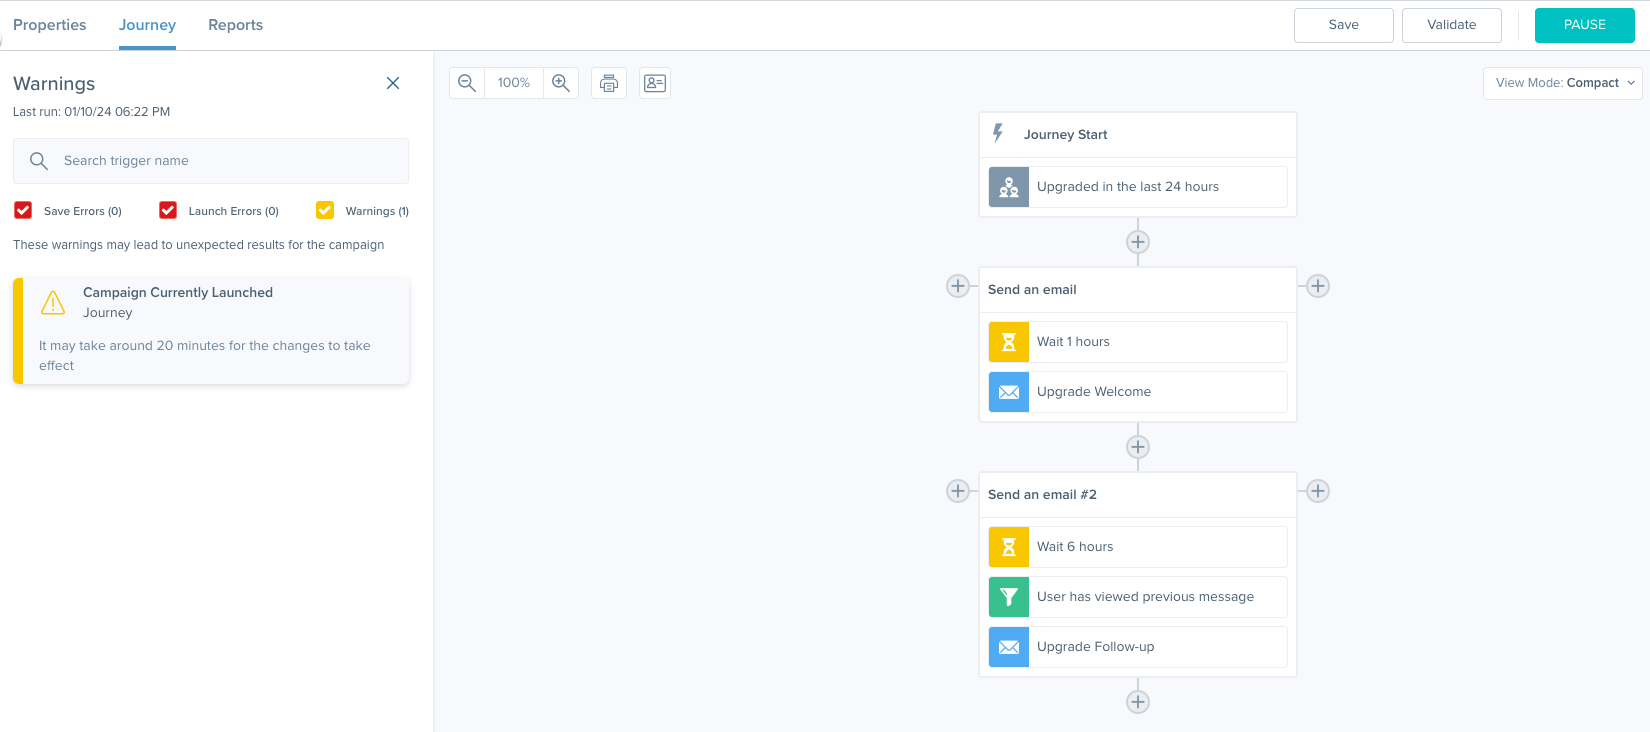
Editing Launched Segment Backed Campaigns
To help you rectify issues or make important changes to launched campaigns instantly, we are introducing the ability to edit launched segment-backed campaigns (i.e. one-time, recurring and segment-triggered campaigns) without having to pause them. This will ensure that there is no downtime for your campaigns and that none of your customers miss an important notification. Any change that you make to a launched campaign will still be validated before it can go live.
It is important to note that changes made to launched campaigns may take up to 20 minutes to take effect due to caching.
Increased Trigger Limit
In order to help you better plan and orchestrate complex customer journeys, we have now doubled the limit on the maximum number of triggers you can add to a journey from 100 to 200.