Activating Customer Data with Graph Technology

GRAPH TECHNOLOGY-POWERED CUSTOMER EXPERIENCE
What do Netflix, Amazon, LinkedIn, Facebook, and Google have in common? While they all serve different needs, they do that in a unique way by delivering an individualized experience to hundreds of millions of users at scale. From a user’s perspective, these brands seem to have an uncanny ability to have a 1:1 conversation, and understand each user’s unique tastes and preferences. In fact, no two users have the same experience with any of these brands. By delivering unique personalized experiences, they have gained incredibly loyal users that keep coming back for more and have become dominant in their respective categories.
But, what technological advantage do these companies have that gives them the ability to deliver individualized experiences at scale? If you look under the hood, unlike the previous generation of consumer companies that built customer experience on traditional IT systems, these leaders leverage a graph-based technology stack.
Before we continue, let me outline what we mean by a graph-based technology stack.
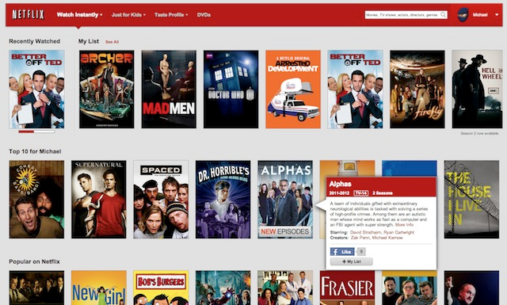
Let’s use Netflix as an illustration.
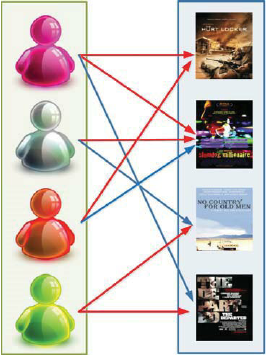
Behind the scenes, Netflix has built one of the largest graph of its users and their content preferences. Each time a user views, rates or adds a movie to a watch list, Netflix updates this graph with the user’s behavior in near real-time. Subsequently, Netflix uses this graph to deliver a rich user experience that recommends the next movie for a user to watch based on techniques such as what’s trending in user’s location, similar user preference, or a user’s affinity to a certain genre based on past behavior. Netflix delivers this experience to the user on all channels including apps, website, and email. Every user engagement enriches the graph for all users. So the next time a user logs in, Netflix can further personalize the experience for the user, keep churn low, and keep users coming back for more.
Similar interaction and data graphs power the consumer experience of Facebook, Amazon, LinkedIn, and Google. In the future, we believe every digital company will have such an interaction graph. While the technology obstacles required to build, maintain, and use such graphs are formidable, the existence of data underlying the graph is undeniable no matter which industry you are in.
CHALLENGES IN BUILDING AN INTERACTION GRAPH
If data is readily available, then why are more brands not able to deliver an individualized and relevant user experience? Past efforts to build individualized experiences using an enterprise data warehouse have failed due to slow ETL processing, long query times, and the disconnected nature of engagement channels that require sub-second response times for accurate decisioning. By the time user data is computed and activated, it is very likely stale and out of date, resulting in user annoyance instead of delight. Some forward-thinking companies have recognized the flaws of a data warehouse driven approach and embarked on building a user graph in-house using open-source graph databases.
Building such a graph in-house has several challenges that include:
- Real-Time: It requires updates in real-time as users interact across websites, mobile, email, and other channels. The graph should support highly concurrent, low-latency writes, and high throughput search/queries.
- Cross-Device: Users may not always be signed in and maybe using multiple devices, which requires tracking plus merging anonymous and known behaviors across devices. The graph service needs to capture device identifiers, cookies, first-party data, and 3rd party data to enable deterministic and probabilistic profile tracking and merges.
- Learning: The graph needs to be enriched with real-time user intents and long-term interests derived from behaviors. This requires algorithms suited for online learning and models that update in near real-time with new data.
- Scale: Depending on the size of the user base and content catalog, the graph may need to scale to processing billions of edges resulting in terabytes of data, while supporting sub-second query responses.
- Data Fragmentation: On-going ETL and building connectors to deal with data fragmentation and evolving data schemas make implementations brittle.
- Resources: Budget and resourcing constraints to hire a team of engineers, analysts, data scientists, and managers to build the technology stack and maintain integrations.
HOW WE USE GRAPH TECHNOLOGY AT BLUESHIFT
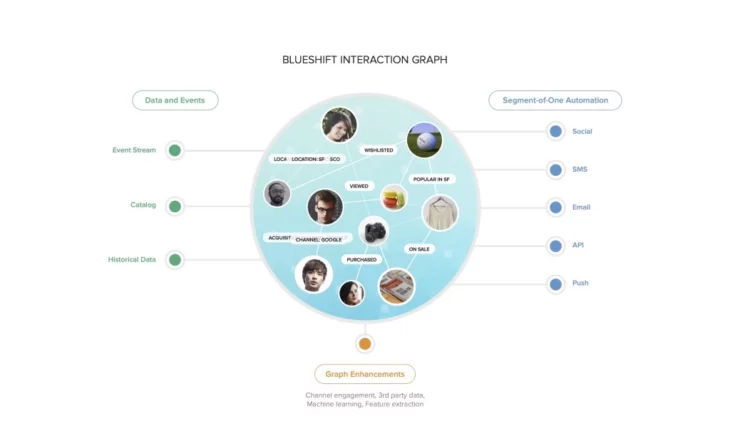
Blueshift’s next-generation customer data platform is powered by an interaction graph: A real-time undirected graph created using 1st party behavior data from every engagement touch-point. Blueshift’s customer data platform captures all your user interactions in real-time and is available across every channel. Blueshift’s Interaction Graph powered CDP is usable out of the box, and companies can onboard terabytes of data in just few days.


