06.01.21 AND 06.15.21
June Updates
06.15.2021
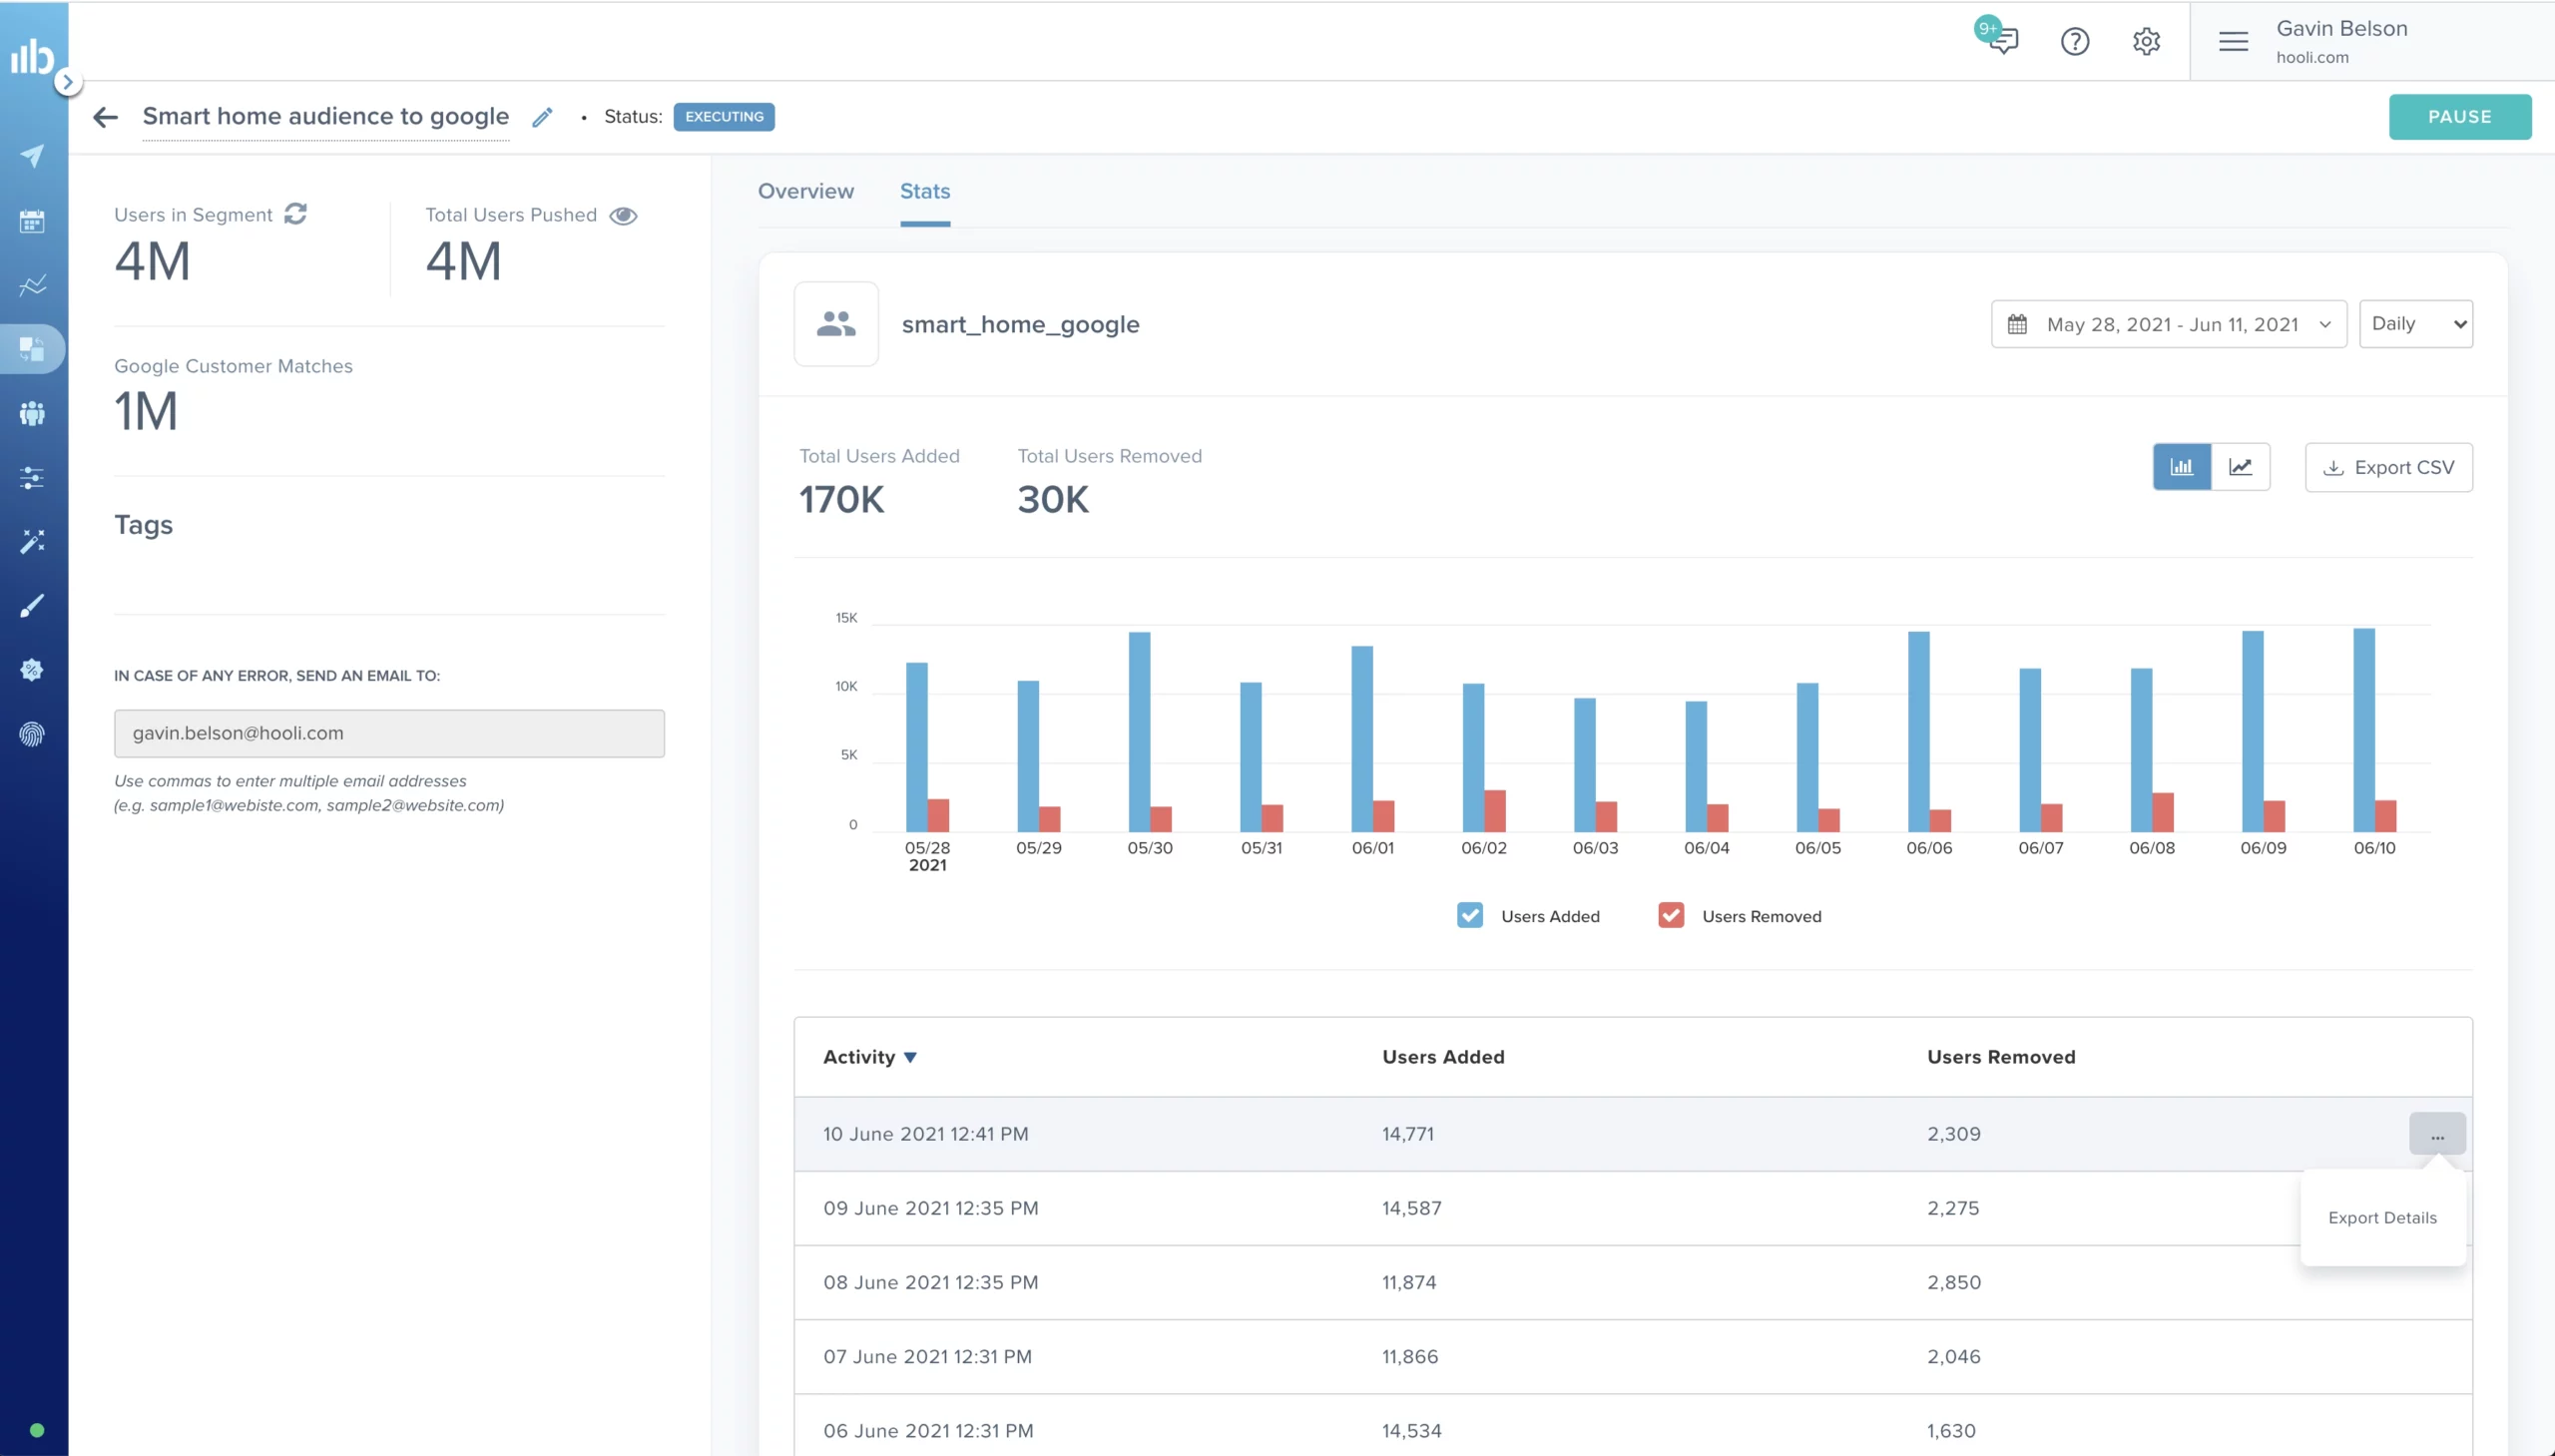
Syndication Analytics
To help monitor segments that you’re syndicating from Blueshift to paid media destinations, we’ve introduced syndication analytics to break down how many users have been pushed to and removed from a destination platform for each syndication. You’ll be able to filter down to a specific date range and see a breakdown of the number of users added to and removed from the destination platform each time the syndication ran and view on a daily, weekly, or monthly basis within the date range that you select.
You will also now be able to visualize how many users were pushed to a particular destination over a period of time in a chart view to better understand the current audience size in a destination. You can also export this data as a CSV file if you want to further analyze the data outside the Blueshift platform.
06.15.2021
Customer Delete API Limit Change
To help reduce the number of API calls you need to make in order to fully delete a customer record, we have increased the limit of our customer delete API endpoint to allow you to delete up to 50 profiles (up from 10 profiles previously). For example, if you have 100 profiles of a customer with the email address [email protected], you will now need to make only 2 API calls as Blueshift will delete 50 profiles of that customer per API call.
Note that the platform takes a couple of hours to delete the customer”s data. This action is irreversible and all customer data will be permanently deleted.
06.15.2021
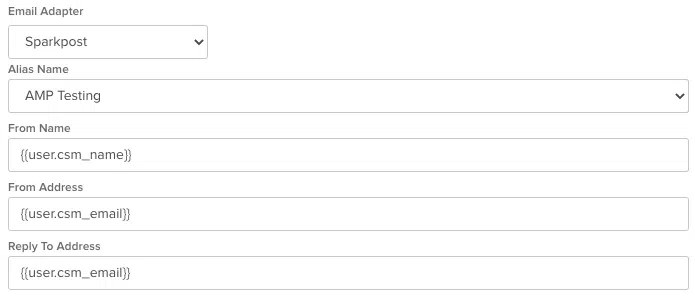
Dynamic From Address
To help make your emails feel more personal, we now support dynamic content in the From Address, From Name, and Reply To Address fields. Now you can make your emails appear to be sent directly from an individual at your company rather than from an email alias.
In the campaign’s email trigger, simply specify the appropriate liquid variable in the ‘from’ or ‘reply to’ fields and our platform will populate these fields with the value for each user.
06.15.2021
New Android and iOS SDKs
We’ve released new versions of our mobile SDKs for both Android (V3.2.1) and iOS (V2.1.18) . Highlights include:
- In-app notification enhancements
- Automatic scaling based on background image dimensions
- Support for responsive HTML content
- Ability to have rounded corners
- Image caching for faster image loading
- Campaign performance tracking enhancements
- Logic to de-dupe multiple clicks on the same push notification
- Device platform is now included in campaign activity/events sent so that you can analyze campaign performance by device type
For more information on the SDKs, please refer to our Android documentation or iOS documentation.
06.01.2021
Campaign Calendar
To give you a quick, simple visualization of all of your upcoming and past campaigns, across all channels, we’ve introduced a Campaign Calendar. The calendar view of campaigns will help you plan campaigns more effectively, providing an at-a-glance view of what campaigns are scheduled for when and what colleagues are scheduling so that you can avoid duplicative messaging.
You can access the calendar from the left navigation panel. On the calendar, you can view campaigns by day, week, or month. You can search for specific campaigns by name, type, status, author, channel, and other attributes. Within the calendar, you can click on a campaign to see more details about it.
06.01.2021
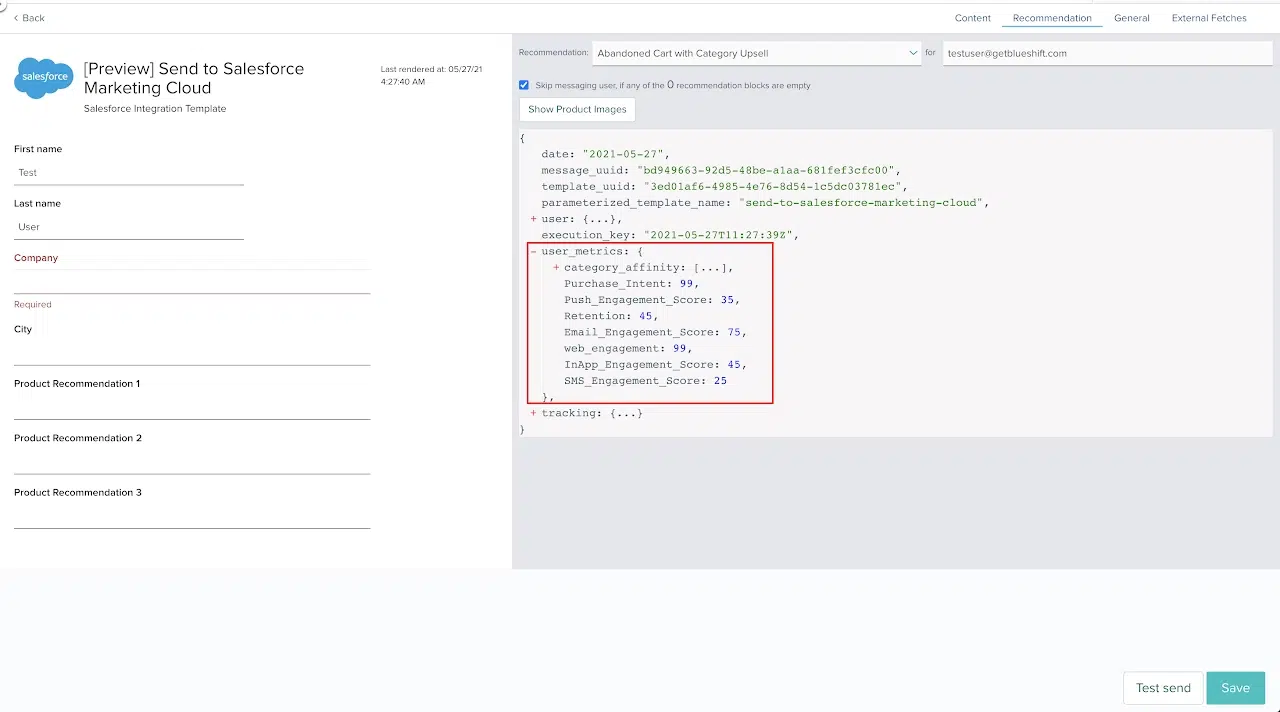
Personalize Content with Predictive User Attributes
To make messages more relevant, you can now use predictive scores and affinities associated with a user profile within your template. Predictive user attributes such as category affinity, channel engagement score, hour affinity, and purchase intent will be available under ‘user_metrics’ as part of the personalization object across all of our creative studios.
With this feature you can include or exclude certain items from an email based on the user’s affinity or their predictive score. You can also use cloud apps to export users’ predictive scores and affinities to other systems.
06.01.2021
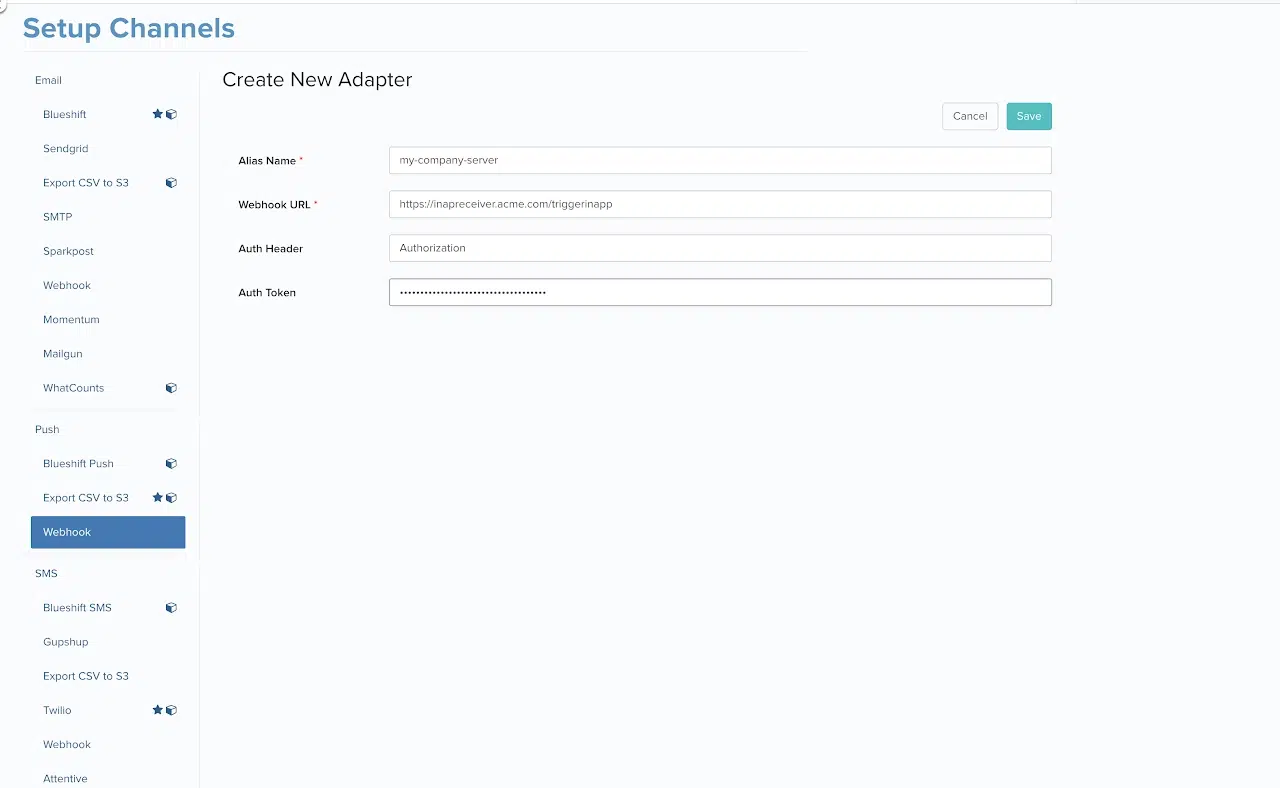
Webhook Adapter for In-App Messages
We’ve introduced a webhook adapter for the in-app channel so that you can take advantage of Blueshift’s Creative Studio for In-App while you use your own or a third party app for sending messages inside your mobile app.
All you need to do is to create an in-app template using Blueshift’s In-App studio and then send a message using this template through a webhook adapter from a campaign journey.
06.01.2021
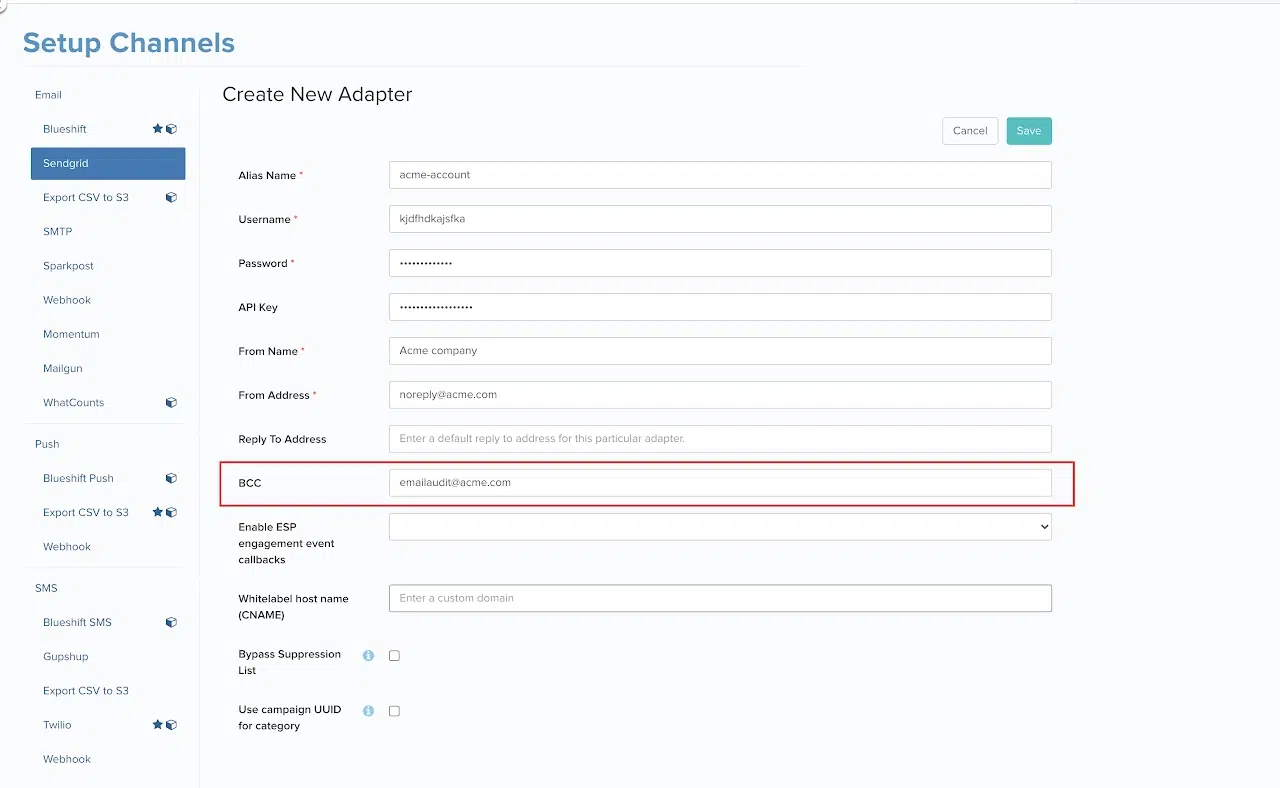
Default BCC Recipients
The BCC feature can be helpful (1) for testing and (2) for saving a copy of the email received by your customers. To make it easy for you to BCC every email you send from the Blueshift platform, we have introduced a BCC field on the email adapter configuration screen. Once you specify one or more BCC recipients for an adapter, we will automatically populate the BCC field whenever you use the adapter in any trigger in a campaign journey.
Going forward, you will also have the option to choose whether the BCC recipients will receive a native BCC or a separate email. Note that with a native BCC send, the BCC recipient and the customer receive the same email from the same send. As a result if the BCC recipient engages with the email (for example s/he opens it), it will reflect as a customer engagement in your campaign stats and will thus impact your metrics. In order to keep your metrics clean, we do not use the native BCC feature. Instead we send a separate email with the exact copy of the customer email to the BCC recipients. If you wish to switch to the native BCC option, you can now do so by reaching out to your CSM or [email protected].